Curves and Sketches
A common concept for solid constructions is the extrusion of a 2-dimensional sketch. This section describes how sketches are created in trCAD.
Curves
In general, the curve data type represents a 1-dimensional path in 2- or 3-dimensional space. A curve is always constructed from a start point followed by successive segments.
The most simple curve may be a straight line that starts at a point p1 and extends to another point p2. To build such a curve, the curve link operator '->' is used:
Example
vector p1 = <[-3,2]>
vector p2 = <[5,7]>
curve c1 = p1 -> p2
p1 is here the start point while p2 represents the first (and only) curve segment.
In the same way the curve can be extended to a polygonal chain:
Example
vector p3 = <[2,6]>
vector p4 = <[4,-1]>
curve c2 = p1 -> p2 -> p3 -> p4
The curve can be closed to form a polygon by either explicitly returning to the starting point or by using the curve closure operator '-><-':
Example
curve c3 = p1 -> p2 -> p3 -> p4 -> p1
curve c4 = p1 -> p2 -> p3 -> p4 -><-
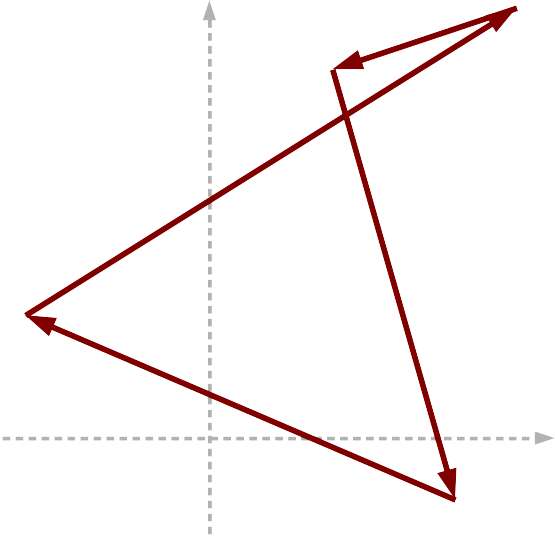
The directional polygon from the example.
Note that curves are inherently directional. It is possible to flip the direction in which the points are following each other by using the curve reversion operator.
Non-linear curve segments
In the previous example, the curve link operator '->' was used to connect single points by straight lines. This was an implicit definition of line_to segements. Sometimes, other types of segment shapes are desired. This can be achieved by using one of the following curve segment constructors:
| line_to | line_dir | arc |
| arc_to | bezier |
Example
curve c5 = <[3,0]> ->
           arc( <[0,0]>, PI * 0.5 ) ->
           line_dir( <[-2,0]> ) ->
           line_dir( <[0,-3]> )
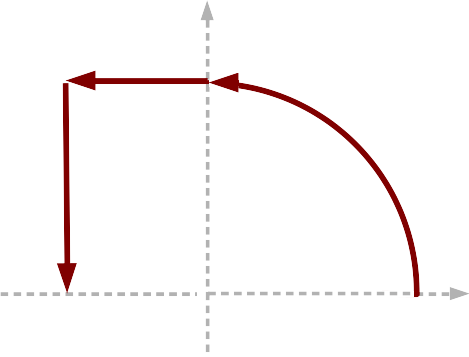
A second curve example.
All curve segments are used in the way that they extends the curve, starting from its terminal point.
Oriented curves
Some constructions require an orientation direction at different points on the curve. One example is the construction of an oriented extrusion of a sketch. Such orientations can be viewed as direction vectors along the curve like shown in this image:
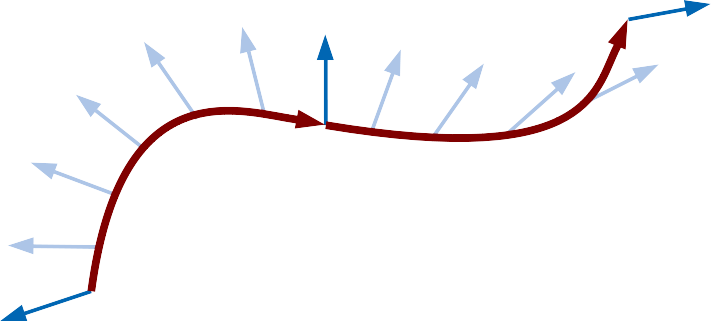
A two-segment-curve with given orientation directions (blue) at the vertex positions and interpolations along the line (light blue).
Orientiation directions are defined inbetween connected curve segments and are implicitly interpolated along the segment. In order to set an orientation direction, its vector value is placed after the segment constructor following the curve orientation operator that is a caret symbol (^):
Example
curve c6 = <[1,0]>^<[-1,0,0]> ->
           line_dir( <[-2,0]> )^<[1,0,0]>
Sketches
In the context of trCAD, a sketch is a set of one or more 2-dimensional closed curves. A sketch can be formed by "adding" or "subtracting" multiple curves:
Example
curve c1 = <[8,0]> -> arc( <[0,0]>, 2PI )
curve c2 = <[4,3]> -> arc( <[3,3]>, 2PI )
curve c3 = <[-4,3]> -> arc( <[-3,3]>, 2PI )
curve c4 = <[5,-1.5]> -> arc_to( <[-5,-1.5]>, 5.5, false ) -> arc_to( <[5,-1.5]>, 5.2 )

sketch s = c1 - c2 - c3 - c4
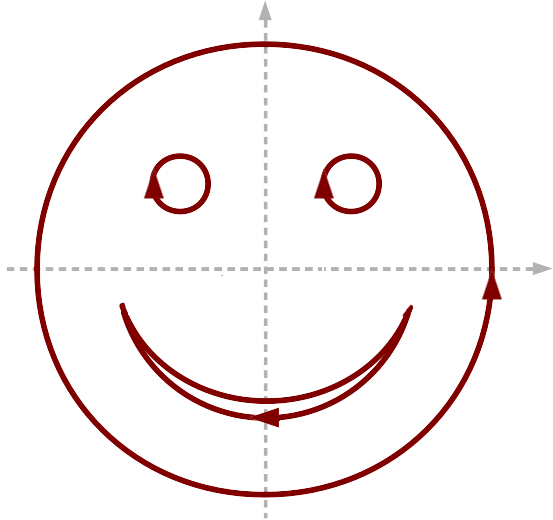
A smiley contour sketch.
The moment a curve gets added to or subtracted from a sketch, it is projected onto the X-Y plane, thus enforcing the sketch to be 2-dimensional. This should be taken into account when working with curves that extend into the Z direction.
Sketches form the basis of solid extrusions. For this, some of the curves were subtracted to the sketch in the example instead of having been added. A subtraction appends a curve to a sketch in the same way as an addition does but also reverts its direction. This can be seen in the figure from the arrows pointing into opposite directions. The effect of different curve directions is explained in more detail in this section.